What Is an Audio Visualizer? A Practical Beginner’s Guide
Learn how audio visualizers turn sound into motion, how waveforms differ from frequency spectra, and how to create your first visual.
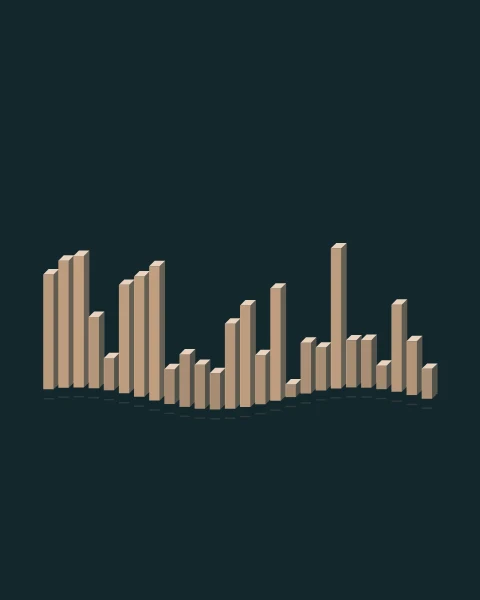
An audio visualizer gives sound a moving image. A voice can become a thin line that changes as someone speaks; a drum-heavy track can become a row of rising bars. For a creator with finished audio and no filmed footage, that movement provides a starting point for a video.
The useful question is what that motion adds to the listening experience. A restrained visual can make a podcast excerpt feel considered. A more energetic one can give a music release a recognizable look. Both begin with the same idea: let the sound influence the picture.
How sound becomes motion
A visualizer reads changing audio values and uses them to draw a picture. The Web Audio specification describes two kinds of analysis available in a browser: time-domain data and frequency-domain data. A developer can use those values to shape a line, resize bars or animate another design.
This does not mean the tool understands a song’s lyrics, identifies its chorus or recognizes a particular instrument. In this version of AudioVisualizer, the movement follows audio measurements and the selected visual design. It is not an automatic music-video director or a beat-detection editor.
Waveform or frequency spectrum?
A waveform traces the audio signal’s amplitude across a short window of time. A frequency spectrum shows how energy is distributed across frequency ranges. A waveform can look like a moving ribbon; a spectrum is often drawn as bars.
In our tool, Echo Trace folds delayed waveform samples into an artistic XY trace, while Lucent Steps turns frequency values into dimensional columns. Halo Atlas maps spectrum values to broken concentric orbits. These are visual choices rather than a ranking of accuracy or quality.
A live waveform is also different from the complete, scrollable waveform you might see in an audio editor. The visualizer shows a changing moment of sound; it does not provide a timeline for cutting the recording.
Where an audio visualizer is useful
- Music releases: give a finished track a visual identity using color, artwork and motion.
- Spoken excerpts: pair a short idea with a readable title and a quiet visual.
- Sound demonstrations: show the difference between a sustained tone, a rhythmic pattern and silence.
A visualizer alone does not explain speech to someone watching without sound. If the words matter, add accurate captions in a separate editor. It also does not replace mixing or mastering: a moving picture cannot repair distorted audio.
Make your first visual with a short file
Open Audio Visualizer and select a local MP3 or WAV that your browser can play. The current tool accepts audio up to five minutes long and smaller than 100 MB. Start with a short excerpt so you can check the whole workflow quickly.
- Choose Lucent Steps or Satin Current so the relationship between sound and motion is easy to observe.
- Set a contrasting visual color and background, then choose the video layout.
- Press Play. Compare a quiet moment with a louder section before changing the sensitivity.
- Export a test using an available format, then play the downloaded file with sound.
The application processes selected audio and images in your browser. The page still needs to load its website resources; local media processing does not mean every website request disappears. Our privacy explanation describes the current behavior.
Keep the first version simple
Use one visual style, one main color and one short title. Watch the result at a small size: if the title disappears or the movement overwhelms the composition, simplify it. Once that version works, experiment with artwork or another style.
Ready to build a finished piece? Follow our music visualizer video walkthrough for a complete creative workflow.